دستیار ترید (By Vahid.Jafarzadeh) 🇮🇷🎉 The first Persian indicator on TradingView, released for free to celebrate my daughter's birthday. 🎉
Trading Assistant (By Vahid.Jz) is an all-in-one tool designed to simplify analysis and improve accuracy. It acts as an intelligent trading partner.
Features:
- Market Structure detection
- Multi-Timeframe "Third Eye" analysis
- Professional Order Blocks recognition
- Fair Value Gaps (FVGs) detection
- Customizable alerts
- Fully Persian interface
Free to use. Contact on Telegram: @vahidjz
“Trading is not a destination; it’s the journey — a path of learning, growth, and experience.”
Buscar en scripts para "order block"

Premium & Liquidity Zones By TradingSmurf ver.20250911=========================================
Premium & Liquidity Zones (PLZ) + AEMA
=========================================
Features:
----------
• Liquidity Zones (Daily / Weekly / Monthly)
- Previous Highs/Lows with text labels
- Auto purge when liquidity is swept
• Adaptive EMA (Kaufman-style)
- Fast = 2, Slow = 30, Efficiency = 10
- Toggle On/Off
• Premium & Discount Zones
- Supply/Demand imbalance shading
• Market Structure Tools
- BOS (Break of Structure) / CHoCH detection
- Order Blocks
- Fair Value Gaps (FVGs)
- MSS signals
- Swing High/Low labels
• Signals & Alerts
- SSMA crossover Buy/Sell signals
- BOS, CHoCH, MSS alerts
Usage:
-------
All-in-one Smart Money Concepts (SMC) toolkit
for liquidity, structure, and adaptive trend
confirmation.

مؤشر الحوت الأول✅ History (Signals)
• Most prominent buy/sell signals (Buy/Sell).
• Smart buy/sell signals (Smart Buy/Sell) are compatible with price alignment with the trend and EMA.
• Reversal indicators (Reversal signals) when the market is overbought/oversold.
• Channel breakouts signals when strong price levels are broken.
⸻
✅ Errors (Trend)
• Average trend bar: A multi-colored set with a custom background color.
• Trend Cloud: A cloud between the EMA150 and EMA250 that gives you the strength of the error (bullish/bearish).
• Chaos trend line: A moving ATR line (like a trailing stop) to confirm the error.
• EMA200: A solid line for general correction.
⸻
✅ Colors and Candlestick Reading
• Candlesticks are colored according to the Relative Strength Index (RSI) or the trend.
• Different colors indicate buying or selling strength (low RSI → red, high RSI →).
⸻
✅ Relative Strength Index + Oversold Zones
• Cap chart based on the Relative Strength Index (RSI):
• Green = Light overbought.
• Red = Light oversold.
• Measures oversold conditions and integrates with Facebook to confirm entry/exit.
⸻
✅ Dashboard
Located below the chart and displays:
• Volatility (weak, very strong, etc.).
• Current RSI value.
• Over the same timeframe (3-minute, 5-minute, 15-minute, 1-hour, 4-hour, daily, etc.).
⸻
✅ Multiple Management (Risk Management)
• Entry – Stop Loss – Stop Loss zones (TP1, TP2, TP3) are found directly on the chart.
• Draws lines and labels at entry, stop, and target levels.
• This feature can be enabled or disabled in the settings.
⸻
✅ Additional Tools
• Order Blocks (off by default in the code).
• Keltner Channels are cloud-like compression/divergence zones.
• Volatility Filter: Measures ATR and Elastic Divergence to give you the strength of the movement.
⸻
📊 In short:
Your indicator isn't just one; it's a complete suite of tools:
• Smart Buy/Sell Signals +
• Trend and Cloud + EMA200
• Reversal and Saturation Signals
• Dashboard for Multi-Timeframe Analysis
• Capital Management with Targets and Stops
Bias Money PrinterThe MSB indicator is a price-action tool designed to automatically map out swing highs, swing lows, and structural breaks on any chart. It highlights when the market transitions between bullish and bearish phases by plotting zigzag structures and labeling key break points.
✅ Key Features
Identifies swing highs and lows in real time
Marks Market Structure Breaks (MSBs) for clearer trend shifts
Helps traders define bullish vs. bearish bias based on structure
Works across all timeframes and markets (forex, futures, crypto, stocks)
Simple visual cues for trend continuation vs. reversal
🎯 Purpose
This indicator removes guesswork from market structure analysis by visually mapping breakpoints where price confirms a new direction. Traders can combine it with volume, supply/demand, or order blocks for high-confidence setups.

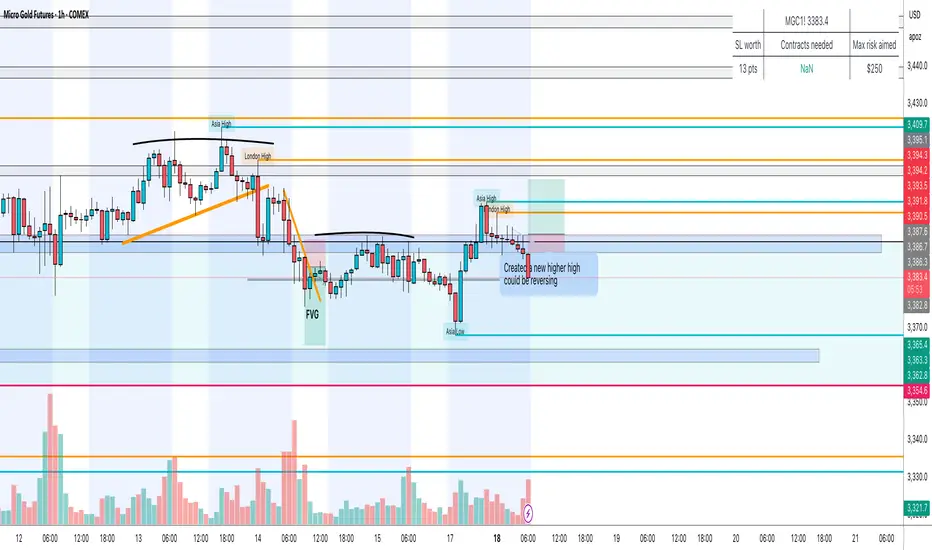
STOCK SCHOOL | FVGThe Stock School FVG Indicator is designed to help traders identify and trade Fair Value Gaps (FVGs) and Inverse FVGs (IFVGs) with precision.
Built for both intraday and swing traders, this tool highlights high-probability trading zones where institutions leave imbalances in the market.
✨ Key Features:
Auto-detects FVGs & IFVGs in real-time
Works on all timeframes and instruments (Nifty, BankNifty, Stocks, Forex, Crypto)
Non-repainting logic for reliable signals
Clean and easy-to-use interface with Stock School styling
Perfect for Smart Money Concept (SMC) traders
🚀 With this indicator, you can:
Spot institutional footprints quickly
Combine with BOS, CHoCH, Order Blocks for high accuracy
Trade liquidity sweeps + FVG collisions with confidence
💡 Disclaimer:
This indicator is for educational purposes only. Trading involves risk. Always use proper risk management.

Perp Imbalance Zones • Pro (clean)USD Premium (perp vs spot) → (Perp − Spot) / Spot.
Imbalance (z-score of that premium) → how extreme the current premium is relative to its own history over lenPrem bars.
Hysteresis state machine → flips to a SHORT bias when perp-long pressure is extreme; flips to LONG bias when perp-short pressure is extreme. It exits only after the imbalance cools (prevents whipsaw).
Price stretch filter (±σ) → optional Bollinger check so signals only fire when price is already stretched.
HTF confirmation (optional) → require higher-timeframe imbalance to agree with the current-TF bias.
Gradient visuals → line + background tint deepen as |z| grows (more extreme pressure).
What you see on the pane
A single line (z):
Above 0 = perp richer than spot (perp longs pressing).
Below 0 = perp cheaper than spot (perp shorts pressing).
Guides: dotted levels at ±enterZ (entry) and ±exitZ (cool-off/exit).
Background tint:
Red when state = SHORT bias (perp longs heavy).
Blue when state = LONG bias (perp shorts heavy).
Tint intensity scales with |z| (via hotZ).
Labels (optional): prints when bias flips.
Alerts (optional): “Enter SHORT/LONG bias” and “Exit bias”.
How to use it (playbook)
Attach & set symbols
Put the script on your chart.
Set Spot symbol and Perp symbol to the venue you trade (e.g., BINANCE:BTCUSDT + BINANCE:BTCUSDTPERP).
Read the bias
SHORT bias (red background): perp longs over-extended. Look for short entries if price is at resistance, σ-stretched, or your PA system agrees.
LONG bias (blue background): perp shorts over-extended. Look for long entries at support/σ-stretched down.
Entries
Use the bias flip as a context/confirm. Combine with your structure trigger (OB/level sweep, rejection wick, micro-break in market structure, etc.).
If useSigma=true, only trade when price is already ≥ upper band (shorts) or ≤ lower band (longs).
Exits
Bias auto-exits when |z| falls below exitZ.
You can also take profits at your levels or when the line fades back toward 0 while price mean-reverts to the middle band.
Tuning (what each knob does)
enterZ / exitZ (signal strictness + hysteresis)
Higher enterZ → fewer, cleaner signals (e.g., 1.8–2.2).
exitZ should be lower than enterZ (e.g., 0.6–1.0) to prevent flicker.
lenPrem (context window for z)
Larger (50–100) = steadier baseline, fewer signals.
Smaller (20–30) = more reactive, more signals.
smoothLen (EMA on z)
2–3 = snappier; 5–7 = smoother/laggier but cleaner.
useSigma, bbLen, bbK (price-stretch filter)
On filters chop. Try bbLen=100, bbK=1.0–1.5.
Off if you want more frequent signals or you already gate with your own σ/Keltner.
useHTF, htfTF, htfZmin (trend/confirmation)
Turn on to require higher-TF imbalance agreement (e.g., trading 1H → confirm with 4H htfTF=240, htfZmin≈0.6–1.0).
hotZ (visual intensity)
Lower (2.0–2.5) heats up faster; higher (4.0) is more subtle.
Ready-made presets
Conservative swing (fewer, higher-conviction):
enterZ=2.0, exitZ=1.0, lenPrem=60–80, smoothLen=5, useSigma=true, bbK=1.5, useHTF=true (240/0.8).
Balanced intraday (default feel):
enterZ=1.6–1.8, exitZ=0.8–1.0, lenPrem=50, smoothLen=3–4, useSigma=true, bbK=1.0–1.25, useHTF=false/true depending on trendiness.
Aggressive scalping (more signals):
enterZ=1.2–1.4, exitZ=0.6–0.8, lenPrem=20–30, smoothLen=2–3, useSigma=false, useHTF=false.
Practical tips
Don’t trade the line in isolation. Use it to time trades into your levels: VWAP bands, Monday high/low, prior POC/VAH/VAL, order blocks, etc.
Perp-led reversals often snap—be ready to scale out quickly back to mid-bands.
Venue matters. Keep spot & perp from the same exchange family to avoid cross-venue quirks.
Alerts: enable after you’ve tuned thresholds for your timeframe so you only get high-quality pings.

CyberTrading01 – CollegePips Exclusive IndicatorVersion 5 – September 2025
This indicator features a custom calculation table based on ATR.
It also identifies various candlestick types according to specific calculations. Then, following trading rules, it detects pivots and key market highs and lows, helping us find the best trading opportunities.
The indicator also has the ability to calculate FVG.
In future versions, Order Blocks and other zones will be added.
To obtain this indicator, you can only contact the Telegram ID: Sceptered_m.

Wick Pressure Zones [BigBeluga]
The Wick Pressure Zones indicator highlights areas where extreme wick activity occurred, signaling strong buy or sell pressure. By measuring unusually long upper or lower wicks and mapping them into gradient volume zones , the tool helps traders identify levels where liquidity was absorbed, leaving behind footprints of supply and demand imbalances. These zones often act as support, resistance, or liquidity sweep magnets .
🔵 CONCEPTS
Extreme Wicks : Large upper or lower shadows indicate aggressive rejection — upper wicks suggest selling pressure, lower wicks suggest buying pressure.
Volumatic Gradient Zones : From each detected wick, the indicator projects a layered gradient zone, proportional to the wick’s size, showing where most pressure occurred.
Liquidity Footprints : These zones mark levels where significant buy/sell volume was executed, often becoming reaction points on future retests.
Automatic Expiration : Zones persist until price decisively trades through them, after which they are cleared to keep the chart clean.
🔵 FEATURES
Automatic Wick Detection : Identifies extreme upper and lower wick events using percentile filtering and Realative Strength Index.
Gradient Zone Visualization : Builds a 10-layer zone from the wick top/bottom, shading intensity according to pressure strength.
Volume Labels : Each zone is annotated with the bar’s volume at the origin point for added context.
Dynamic Zone Extension : Zones extend to the right as long as they remain relevant; once price closes through them, they are removed.
Support & Resistance Mapping : Upper wick zones (red) behave like supply/resistance, lower wick zones (green) like demand/support.
Clutter Control : Limits the number of active zones (default 10) to keep charts responsive.
Background Highlighting : Optional background shading when new wick zones appear (red for sell, green for buy).
🔵 HOW TO USE
Look for Upper Wick Zones (red) : Indicate strong selling pressure; watch for resistance, reversals, or liquidity sweeps above.
Look for Lower Wick Zones (green) : Indicate strong buying pressure; watch for support or liquidity sweeps below.
Trade Retests : When price returns to a zone, expect a reaction (bounce or rejection) due to leftover liquidity.
Combine with Context : Align wick pressure zones with HTF support/resistance, order blocks, or volume profile for stronger signals.
Use Volume Labels : High-volume wicks indicate more significant liquidity events, making the zone more likely to act as a strong reaction point.
🔵 CONCLUSION
The Wick Pressure Zones is a powerful way to visualize hidden liquidity and aggressive rejections. By mapping extreme wick events into dynamic, volume-annotated zones, it shows traders where the market absorbed heavy buy/sell pressure. These levels frequently act as magnets or turning points, making them valuable for timing entries, stop placement, or fade strategies.

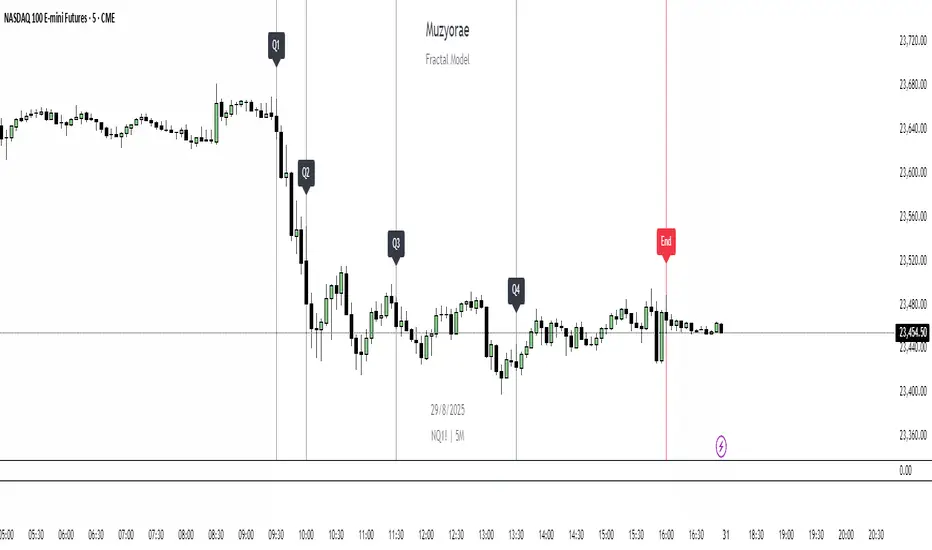
Muzyorae - Quarterly TheoryQuarterly Theory — NY Session Macro Model
The Quarterly Theory Model is a structured framework for analyzing intraday market behavior based on institutional activity and macro-level cycles.
It divides the New York trading session into four sequential “quarters” (Q1–Q4), each representing distinct phases of market participation, liquidity accumulation, and directional bias.
This model is designed for professional traders who aim to align their strategies with institutional flows, key liquidity zones, and market structure shifts.
It accommodates both AMDX (Accumulation → Manipulation → Distribution → Expansion) and XAMD (reversal sequences) fractal patterns, allowing traders to adapt to varying market conditions.
Price action may expand early during Q1 in an XAMD sequence, representing an initial breakout or early liquidity sweep before the typical Q2 manipulation phase. Traders should be aware that Q1 can occasionally produce unexpected volatility or directional bias in such sequences.
Session Breakdown (New York Time)
Q1 – Accumulation
Time: 9:30 – 10:00 AM
Phase Characteristics: Early session positioning, initial liquidity sweeps, and false moves. Institutions build positions while retail participants often react to gaps and premarket activity.
Note: Price may expand early in an XAMD sequence, creating a short-term directional move before Q2.
Q2 – Manipulation / Expansion
Time: 10:00 – 11:30 AM
Phase Characteristics: The main directional move develops, often characterized by breaks of structure, fair value gaps, and liquidity sweeps. This is a prime area for trend initiation.
Q3 – Distribution / Retracement
Time: 11:30 AM – 1:30 PM
Phase Characteristics: Price consolidates and retraces into prior accumulation zones, reflecting profit-taking or redistribution by institutions. Market chop and sideways movement are common.
Q4 – Final Expansion / Repricing
Time: 1:30 – 4:00 PM
Phase Characteristics: The afternoon session often produces final liquidity sweeps, trend continuation, or reversals, setting the high or low of the day and completing the daily macro cycle.
Key Features of the Model
Fractal-Based Structure: Q1–Q4 cycles reflect institutional behavior at a macro level, scalable to other intraday or multi-day fractals.
Supports AMDX & XAMD: Allows for both standard accumulation → manipulation → distribution → expansion sequences and reversal patterns depending on market behavior.
Early Expansion in Q1: Recognizes that in XAMD sequences, Q1 may produce early directional moves or breakout activity.
True Open Q2 Line: Highlights the opening price of Q2 as a reference for trend validation and potential entry zones.
Dynamic Time Alignment: Fully synchronized with New York (ET) time zone, ensuring accurate representation of market cycles.
Professional Visualization: Optional labels and vertical markers for each quarter, supporting quick visual analysis and pattern recognition.
Integration with ICT Concepts: Compatible with Smart Money Techniques (SMT), Fair Value Gaps (FVGs), Order Blocks (OBs), and Break of Structure (BOS) for enhanced trade planning.
Purpose and Application
Anticipates areas of liquidity accumulation and manipulation.
Identifies optimal entry and exit zones within institutional cycles.
Structures trades around probable trend initiation and continuation periods.
Aligns retail activity with institutional flow for higher probability setups.
Adapts to market variability through AMDX and XAMD fractal patterns.
Accounts for early expansions or breakout activity during Q1 in XAMD sequences.
By using the Quarterly Theory Model, traders gain a systematic, time-based framework to interpret market structure and maximize alignment with institutional participants.
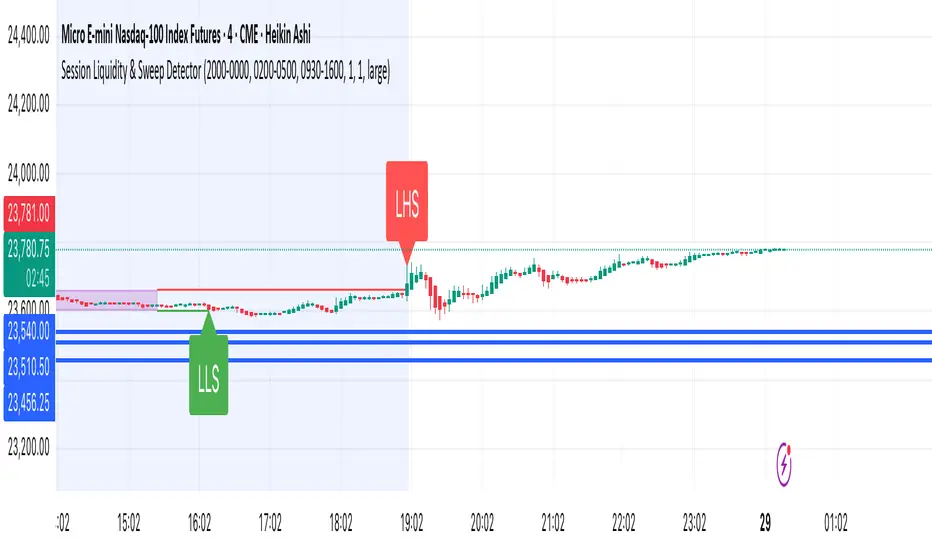
Session Liquidity & Sweep DetectorThe indicator is an advanced trading tool designed to give traders a complete visual and analytical overview of major market sessions. By tracking the Asia, London, and New York sessions, this indicator highlights session highs/lows, liquidity sweeps, and advanced A++ patterns to help identify high-probability trade setups.
It combines session analysis, sweep detection, and pattern recognition into a single, customizable indicator. Traders can use it for spotting breakout points, reversal setups, and areas of stop hunts or liquidity grabs.
Key Features:
1. Session Liquidity Boxes:
Automatically draws boxes representing Asia, London, and NY trading sessions on the chart.
Each session box is color-coded and fully customizable (colors, transparency, border width).
Option to display only the most recent session box, reducing chart clutter.
Helps traders visually separate trading sessions and understand session structure.
2. High/Low Sweep Detection:
Detects when price sweeps the high or low of a completed session, indicating liquidity grabs or stop-hunting behavior.
Labels are added to the chart for clear visualization:
AHS: Asia High Swept
ALS: Asia Low Swept
LHS: London High Swept
LLS: London Low Swept
Horizontal lines are drawn at swept levels to track key support/resistance points.
Sweep detection occurs only within the same trading day, preventing false signals.
3. A++ Pattern Detection:
Detects advanced Long/Short A++ patterns based on session sweep behavior:
Long A++ Pattern: Both Asia and London lows are swept, but highs remain intact.
Short A++ Pattern: Both Asia and London highs are swept, but lows remain intact.
Patterns are plotted with customizable labels to highlight potential high-probability setups.
Helps traders identify early directional bias for the trading day.
4. Customizable Visual Settings:
Box colors, sweep line colors, and label colors are fully customizable.
Label sizes can be set to “auto”, “tiny”, “small”, “normal”, “large”, or “huge”.
Sweep line width and box border width are adjustable.
Clear visualization ensures traders can analyze sessions quickly and efficiently.
5. Multi-Session Tracking:
Tracks Asia, London, and New York sessions independently.
Keeps historical session data while dynamically updating the latest session in real-time.
Allows traders to see inter-session liquidity interactions, which are key for breakout and reversal strategies.
6. Optimized for Real-Time Trading:
Updates session highs/lows bar by bar during live trading.
Works on any timeframe, making it suitable for scalping, intraday, and swing trading.
Integrates seamlessly with other indicators like FU Candle Indicator, VWAP, Order Blocks, and more for advanced strategies.
Use Cases:
Liquidity Hunting: Spot where institutional traders may be triggering stop losses or grabbing liquidity.
Breakout Analysis: Identify when price breaks through session highs/lows and confirm trade direction.
Session Pattern Trading: Use A++ patterns to anticipate strong directional moves early in the trading day.
Multi-Session Strategies: Analyze relationships between Asia, London, and NY sessions to find high-probability entries.
Scalping & Day Trading: Visualize key levels for quick trade decisions.
Ideal Users:
Forex, crypto, and futures traders who want a session-based liquidity and sweep analysis.
Traders who use high-probability patterns and breakout strategies.
Scalpers, intraday traders, and swing traders looking for clear visual cues and actionable signals.
Anyone seeking a comprehensive session overview for smarter trading decisions.
This indicator essentially combines session boxes, liquidity sweep labels (AHS, ALS, LHS, LLS), horizontal lines for swept levels, and A++ pattern detection to give traders a full view of market structure, liquidity, and potential directional bias.
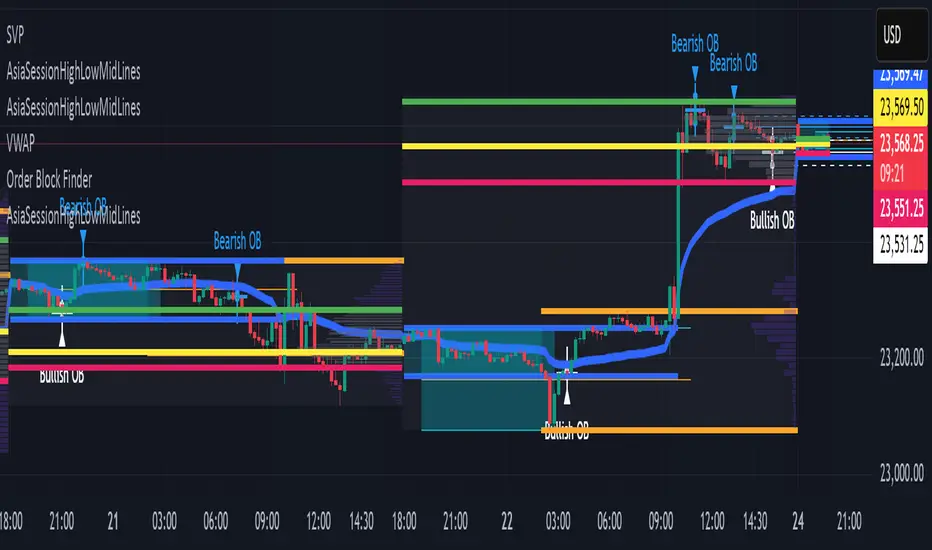
FXC Order Block FinderThis indicator highlights potential VWAP reversion zones using delta volume (buy vs sell imbalance) combined with order flow confirmation. When price extends away from VWAP with strong delta imbalance, zones are plotted where reversals or mean reversion moves are more likely to occur. Helps traders visualize exhaustion points, liquidity grabs, and reversion setups around VWAP. Works best on intraday timeframes with futures, indices, and liquid markets.

OB/FVG Precision Overlap ZonesThis indicator highlights only the zones where Order Blocks (OBs) and Fair Value Gaps (FVGs) overlap, filtering out weaker signals. By focusing on these confluence areas, it helps identify higher-probability entries and cleaner risk to reward setups.

Trendlines, SMC, SR, This is a Comprehensive Indicator - It includes Trendlines and shows break outs, SMC, FV gaps, Order Blocks, Support and Resistance, Moving Averages, and Kernel Switch. "All in One"

Auto Orderblock Generator Pro Version 3.1 IndicatorThis indicator automatically generates order blocks on any time frame so you can analyze charts with precision and know where high areas of liquidity lie in real time.
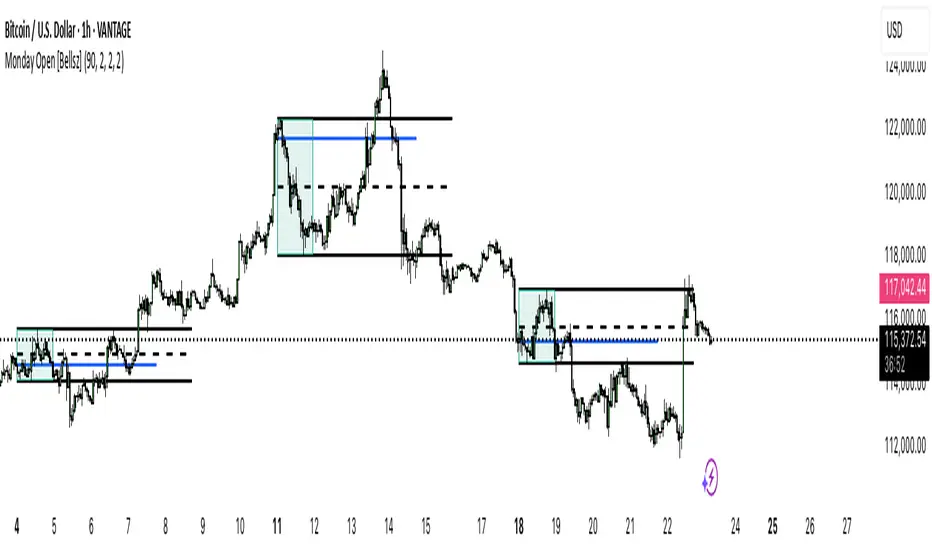
Monday Open [Bellsz]Plots the NY Monday range with box, High/Low, EQ, and Monday Open, then projects those levels forward by N bars. Clean weekly framing for liquidity targets and mean reversion.
Purpose
Maps the full New York Monday (00:00–23:59 NY time) and projects its High, Low, EQ (midpoint), and Monday Open forward. Use it to frame the week’s liquidity map, “magnet” levels, and mean-reversion targets with one glance.
What it draws
Monday Box — live-updating box for the NY Monday session (fill + border).
High/Low (solid lines) — locked at Monday close and optionally extended N bars.
EQ / Midline (dashed) — (High + Low) ÷ 2, extended N bars.
Monday Open (solid line) — projected from Monday’s first bar, extended N bars during Monday (temporary), then replaced by a fixed Monday-Open line at session end.
How it works
Detects NY calendar day without dayofyear and anchors to America/New_York.
Starts tracking at NY Monday 00:00; updates the box/high/low in real time.
When Monday ends, the script freezes the range and plots final H/L/EQ + Open, extending each by your chosen number of bars.
No lookahead; levels are only finalized after Monday completes.
Inputs
Extend lines (bars →) — how far to project H/L/EQ/Open into the future.
Monday Box Fill / Border — style the range box.
High/Low Line Color / Width — style Monday H & L.
EQ Line Color / Width — style midpoint.
Monday Open Color / Width — style the Monday open.
Why use this indicator
Weekly bias framing: Monday’s range often acts as the reference box for the week’s expansion.
Liquidity targeting: Equal highs/lows and EQ act as common magnet/rebalance areas.
Confluence: Combine with sessions/killzones, FVGs, order blocks, or news timing.
Best practices
Keep chart on your normal trading TF (M5–H1 for intraday, H4–D for swing).
Watch EQ taps and previous Monday H/L sweeps Tuesday–Friday.
Pair the projection length with your strategy’s average holding horizon.
Notes & limitations
All timing is NY session-based (America/New_York). If your symbol trades Sunday evening (futures/FX), Monday begins at 00:00 NY as coded.
Market holidays that shift liquidity can affect the “feel” of Monday’s range.
Works on any symbol/TF supported by TradingView. No repainting after Monday close.
SCTI-D1SCTI-D1 Indicator Introduction / 指标简介
The SCTI-D1 (Smart Composite Trading Indicator - Daily) is a comprehensive, multi-feature trading tool designed for serious traders who demand depth, flexibility, and clarity in their market analysis. This indicator combines several powerful concepts into one seamless workflow, including:
Multiple EMA Systems with customizable lengths and visibility
PMA (Projected Moving Average) with fill options between lines
VWAP with configurable anchors and deviation bands
Divergence Detection for MACD and Histogram
Volume Profile with node detection (peaks, troughs, highs, lows)
Smart Money Concepts including order blocks, fair value gaps, equal highs/lows, and market structure shifts
Whether you trade stocks, forex, or cryptocurrencies, the SCTI-D1 helps you identify key levels, track institutional activity, and spot high-probability reversal signals—all in one clean, customizable interface.
SCTI-D1 指标简介
SCTI-D1(智能综合交易指标 - 日线版)是一款功能全面的交易工具,专为需要深度、灵活性和清晰市场分析的专业交易者设计。该指标将多种强大概念融合在一个流畅的工作流程中,包括:
多组EMA系统,可自定义长度和显示
PMA(投影移动平均线),支持均线间填充色
VWAP,可配置锚定周期和偏差带
背离检测,支持MACD和柱状图
成交量分布,支持节点检测(峰值、谷值、最高、最低)
聪明钱概念,包括订单块、公允价值缺口、等高/等低和市场结构转换
无论您交易股票、外汇还是加密货币,SCTI-D1 都能帮助您识别关键水平、跟踪机构资金动向并发现高概率反转信号——所有功能均集成在一个清晰可定制的界面中。

ICT Structure Levels (ST/IT/LT) - v7 (by Jonas E)ICT Structure Levels (ST/IT/LT) – Neighbor-Wick Pivots
This indicator is designed for traders following ICT-style market structure analysis. It identifies Short-Term (ST), Intermediary (IT), and Long-Term (LT) swing highs and lows, but with a stricter filter that reduces false signals.
Unlike standard pivot indicators, this script requires not only that a bar makes a structural high/low, but also that the neighboring bars’ extremes are formed by wicks rather than flat-bodied candles. This wick condition helps confirm that the level is a true liquidity sweep and not just random price action.
How it works (conceptual):
Detects pivots based on user-defined left/right bars.
Validates that extremes on both sides of the pivot are wick-driven (high > body for highs, low < body for lows).
Marks valid STH/STL, ITH/ITL, and LTH/LTL directly on the chart with optional price labels.
Uses ATR offset for better label readability.
Alerts can be enabled to notify when a new structural level is confirmed.
How to use it:
Map market structure across multiple layers (ST/IT/LT).
Identify true liquidity grabs and avoid false highs/lows.
Integrate with Break of Structure (BOS) and Change of Character (CHoCH) strategies.
Combine with other ICT concepts (Order Blocks, Fair Value Gaps, Liquidity Pools).
What makes it unique:
Most pivot indicators mark every high/low indiscriminately. This script filters pivots using wick validation, which significantly reduces noise and focuses only on the levels most relevant to liquidity-based trading strategies.

AI Fib Strategy (Full Trade Plan)This indicator automatically plots Fibonacci retracements and a Golden Zone box (61.8%–65% retracement) based on the 4H candle body high/low.
Features:
Auto-detects session breaks or daily breaks (configurable).
Draws standard Fib retracement levels (0%, 23.6%, 38.2%, 50%, 61.8%, 78.6%, 100%).
Highlights the Golden Zone for high-probability trade entries.
Optional Take Profit extensions (TP1, TP2, TP3).
Fully compatible with Pine Script v6.
Usage:
Best applied on intraday charts (15m, 30m, 1H).
Use the Golden Zone for entry confirmations.
Combine with candlestick patterns, order blocks, or volume for stronger signals.

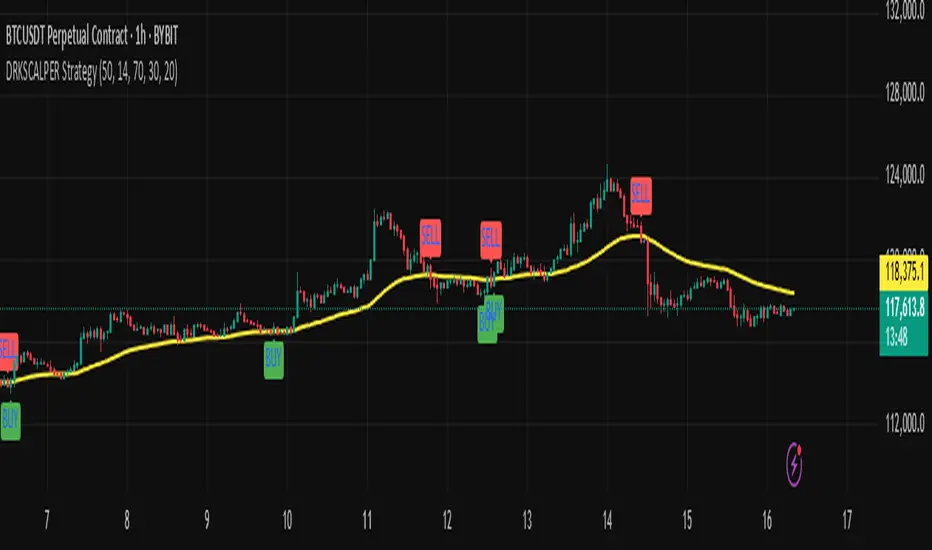
DRKSCALPER Strategy"This indicator is designed to help traders identify market structure shifts, order blocks, and liquidity zones. It is useful for scalping and swing trading, and works on multiple timeframes."
Cvd Divergence Signals with filter.
CVD Divergence + Candles - False Signal Filter
Hey traders,
I want to share my custom indicator with you. Through testing, I've found that CVD (Composite Volume Delta) captures divergences much more accurately than traditional tools like RSI. But this isn't just another divergence indicator - I've added strict candlestick pattern confirmation to filter out false signals. I'll keep improving this tool over time, and I welcome all your suggestions in the comments.
How it works step-by-step:
1. First, it detects CVD divergences (the delta between buy/sell volumes)
2. Then confirms each signal with reversal candlestick patterns:
- Hammer/Hanging Man
- Engulfing
- Pin Bar
- Inside Bar
Why mine beats standard CVD indicators:
• No raw divergences - only shows signals confirmed by BOTH volume AND price action
• Eliminates 80% of junk signals from basic versions
• Adaptable to any asset and timeframe
Simple usage guide:
Green arrows = Buy when:
- CVD shows bullish divergence
- AND a hammer/pin bar appears
Red arrows = Sell when:
- CVD shows bearish divergence
- Confirmed by hanging man/engulfing pattern
Pro tip:
For best results, combine with:
• Volume profile analysis
• Smart Money concepts (order blocks, FVGs )
Important notes:
This isn't a holy grail - I personally use it with support/resistance levels. Works best on 5M charts for scalping.
**PS** Got questions? Drop them in comments!

Session High/Low Sweeps ICT — Asian/London/NY (Big Sal Trades)Description:
This tool automatically tracks session or timeframe highs and lows, plots them on your chart, and removes them instantly when price sweeps or touches them — so you never deal with stale levels again.
⸻
Core Features
• Dynamic High/Low Plotting – Color-coded lines for multiple sessions or timeframes.
• Touch-to-Delete – Levels are deleted automatically when price touches or breaks them.
• Lookback Pruning – Remove old levels after a set number of bars/days.
• Multi-Timeframe Support – Works on intraday and higher timeframes.
• Custom Sensitivity – Choose tick buffer, wick vs close confirmation, and session types.
• No Repainting – Updates in real time, keeps your chart accurate.
⸻
Settings Instructions
Session Selection
• Toggle Asia, London, NY or other sessions you want to track.
Delete on Touch Settings
• Confirm Type:
• Wick – Delete as soon as price wick touches/breaks the level.
• Close – Delete only if candle closes beyond the level.
• Confirm Ticks:
• 0 – Instant deletion on touch.
• 1–2+ – Require price to exceed by this many ticks before deletion.
Lookback Settings
• Max Days/Bars: Remove levels older than this period.
Line Style Settings
• Customize color, style, and width for each session/timeframe to keep charts organized.
⸻
Tip:
Use a small tick confirmation for fast-moving markets like NASDAQ, and larger confirmation for slower assets. Combine with liquidity zones, order blocks, or SMC concepts for powerful trade confluence.
Fibs Has Lied 🌟 Fibs Has Lied - Indicator Overview 🌟
Designed for indices like US30, NQ, and SPX, this indicator highlights setups where price interacts with key EMA levels during specific trading sessions (default: 6:30–11:30 AM EST).
🌟 Key Features & Levels 🌟
🔹EMA Crossover Setups
The indicator uses the 100-period and 200-period EMAs to identify bullish and bearish setups:
- Bullish Setup: Triggers when the 100 EMA crosses above the 200 EMA, followed by two consecutive candles opening above the 100 EMA, with the low within a specified point distance (e.g., 20 points for US30).
- Bearish Setup: Triggers when the 100 EMA crosses below the 200 EMA, followed by two consecutive candles opening below the 100 EMA, with the high within the point distance.
- Signals are marked with green (buy) or red (sell) triangles and text, ensuring you don’t miss a setup. 📈
🔹 Reset Conditions for Re-Entries
After an initial setup, the indicator watches for “reset” opportunities:
- Buy Reset: If price moves below the 200 EMA after a bullish crossover, then returns with two consecutive candles where lows are above the 100 EMA (within point distance), a new buy signal is plotted.
- Sell Reset: If price moves above the 200 EMA after a bearish crossover, then returns with two consecutive candles where highs are below the 100 EMA (within point distance), a new sell signal is plotted.
This feature captures additional entries after liquidity grabs or fakeouts, aligning with ICT’s manipulation concepts. 🔄
🔹 Session-Based Filtering
Focus your trades during high-liquidity windows! The default session (6:30–11:30 AM EST, New York timezone) targets the London/NY overlap, where price often seeks liquidity or sets up for reversals. Toggle the time filter off for 24/7 signals if desired. 🕒
🔹Symbol-Specific Point Distance
Customizable entry zones based on your chosen index:
- US30: 20 points from the 100 EMA.
- NQ: 3 points from the 100 EMA.
- SPX: 2.5 points from the 100 EMA.
This ensures setups are tailored to the volatility of your market, maximizing relevance. 🎯
🔹 Market Structure Markers (Optional)
Visualize swing points with pivot-based labels:
- HH (Higher High): Signals uptrend continuation.
- HL (Higher Low): Indicates potential bullish support.
- LH (Lower High): Suggests weakening uptrend or reversal.
- LL (Lower Low): Points to downtrend continuation.
- Toggle these on/off to keep your chart clean while analyzing trend direction. 📊
🔹 EMA Visualization
Optionally plot the 100 EMA (blue) and 200 EMA (red) to see key levels where price reacts. These act as dynamic support/resistance, perfect for spotting liquidity pools or ICT’s Power of 3 setups. ⚖️
🌟 Customization Options 🌟
- Symbol Selection: Choose US30, NQ, or SPX to adjust point distance for entries.
- Time Filter: Enable/disable the 6:30–11:30 AM EST session to focus on high-liquidity periods.
- EMA Display: Toggle 100/200 EMAs on/off to reduce chart clutter.
- Market Structure: Show/hide HH/HL/LH/LL labels for cleaner analysis.
- Signal Markers: Green (buy) and red (sell) triangles with text are auto-plotted for easy identification.
🌟 Usage Tips 🌟
- Best Timeframes: Use on 3m for intraday scalping and 30m for swing trades.
- Combine with ICT Tools: Pair with order blocks, fair value gaps, or kill zones for stronger setups.
- Focus on Session: The default 6:30–11:30 AM EST session captures London/NY volatility—perfect for liquidity-driven moves.
- Avoid Overcrowding: Disable market structure or EMAs if you only want setup signals.

Fractal Suite: MTF Fractals + BOS/CHOCH + OB + FVG + Targets Kese Way
Fractals (Multi-Timeframe): Automatically detects both current-timeframe and higher-timeframe Bill Williams fractals, with customizable left/right bar settings.
Break of Structure (BOS) & CHoCH: Marks structural breaks and changes of character in real time.
Liquidity Sweeps: Identifies sweep patterns where price takes out a previous swing high/low but closes back within range.
Order Blocks (OB): Highlights the last opposite candle before a BOS, with customizable extension bars.
Fair Value Gaps (FVG): Finds 3-bar inefficiencies with a minimum size filter.
Confluence Zones: Optionally require OB–FVG overlap for high-probability setups.
Entry, Stop, and Targets: Automatically calculates entry price, stop loss, and up to three take-profit targets based on risk-reward ratios.
Visual Dashboard: Mini on-chart table summarizing structure, last swing points, and settings.
Alerts: Set alerts for new fractals, BOS events, and confluence-based trade setups.
